hi there 👋🏽, i'm
Hussein Ali
BI Developer and Data Analyst with a Computer Science background, specialized in data technologies and passionate about building impactful Business solutions
hi there 👋🏽, i'm
BI Developer and Data Analyst with a Computer Science background, specialized in data technologies and passionate about building impactful Business solutions


Who is Hussein Ali?
I'm a Computer Science graduate with a specialization in Data and a strong passion for Business Intelligence (BI).
I enjoy transforming raw data into actionable insights and building smart, user-focused solutions. I've collaborated on various projects, working with developers and analysts to deliver clean, maintainable code and effective BI dashboards.
Through both formal education and self-learning, I've developed a solid foundation in data analytics, visualization, and software development, and I actively apply these skills in real-world scenarios.
When I'm not working with data or sharpening my BI skills,I spend time playing e-games, learning chess, or exploring new hobbies that keep my mind active and creative 🎮♟️.
My Skills
As a Computer Science graduate with a specialization in Data and a strong passion for Business Intelligence, I’ve taken several online and hands-on courses. I enjoy working with data-driven technologies that uncover insights and support smart decision-making.
My projects
I like to stay busy and always have a project in the works. Take a look at some of the applications I've have built

Showgeist is a data-driven Streamlit web app offering interactive TV show analytics. Dive into trends, episode-level stats, genre dynamics, and viewing patterns — all in a clean, interactive interface.

A data analytics project that explores supermarket sales data using Python. The analysis uncovers key insights on branch performance, customer demographics, product line revenue, and payment methods — helping inform data-driven business decisions.

A detailed Power BI dashboard to monitor and optimize U.S. healthcare operations (2019–2020). The dashboard tracks patient growth, CPT units, medical expenses, payer performance, and revenue trends, aiding operational decisions across multiple metrics.

SCHEDULIZER is a Python package for simulating and visualizing classic CPU scheduling algorithms like FCFS, SJF, Priority, and Round Robin. Designed for educational use, it helps learners understand scheduling behaviors via interactive examples and execution flow charts.

A critical look at the current AI boom, exploring how hype-driven decisions echo past tech bubbles. What are we overlooking in our pursuit of innovation?
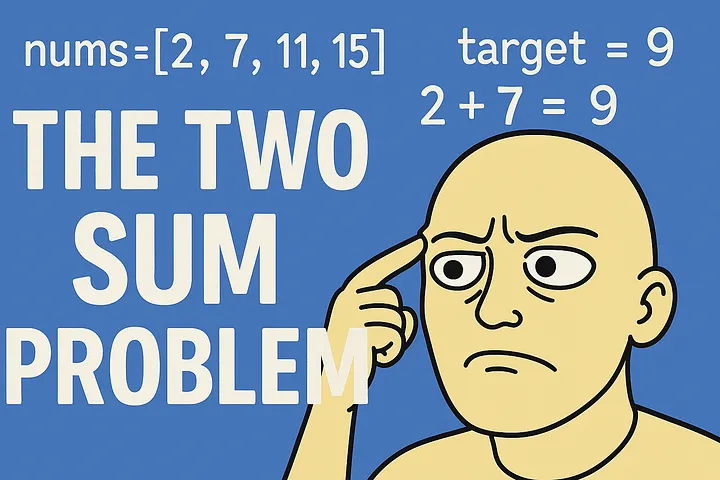
A beginner-friendly walkthrough of LeetCode's Two Sum problem, covering brute-force, optimized hash-map approaches, and real-world interview tips.
Have a project? or just looking to hire?
Feel free to reach out if you're looking to hire, just want to connect or see if we can build something amazing together.